How Can We Help?
How can I confirm the warehouse contains a comprehensive data set for reports to be run over?
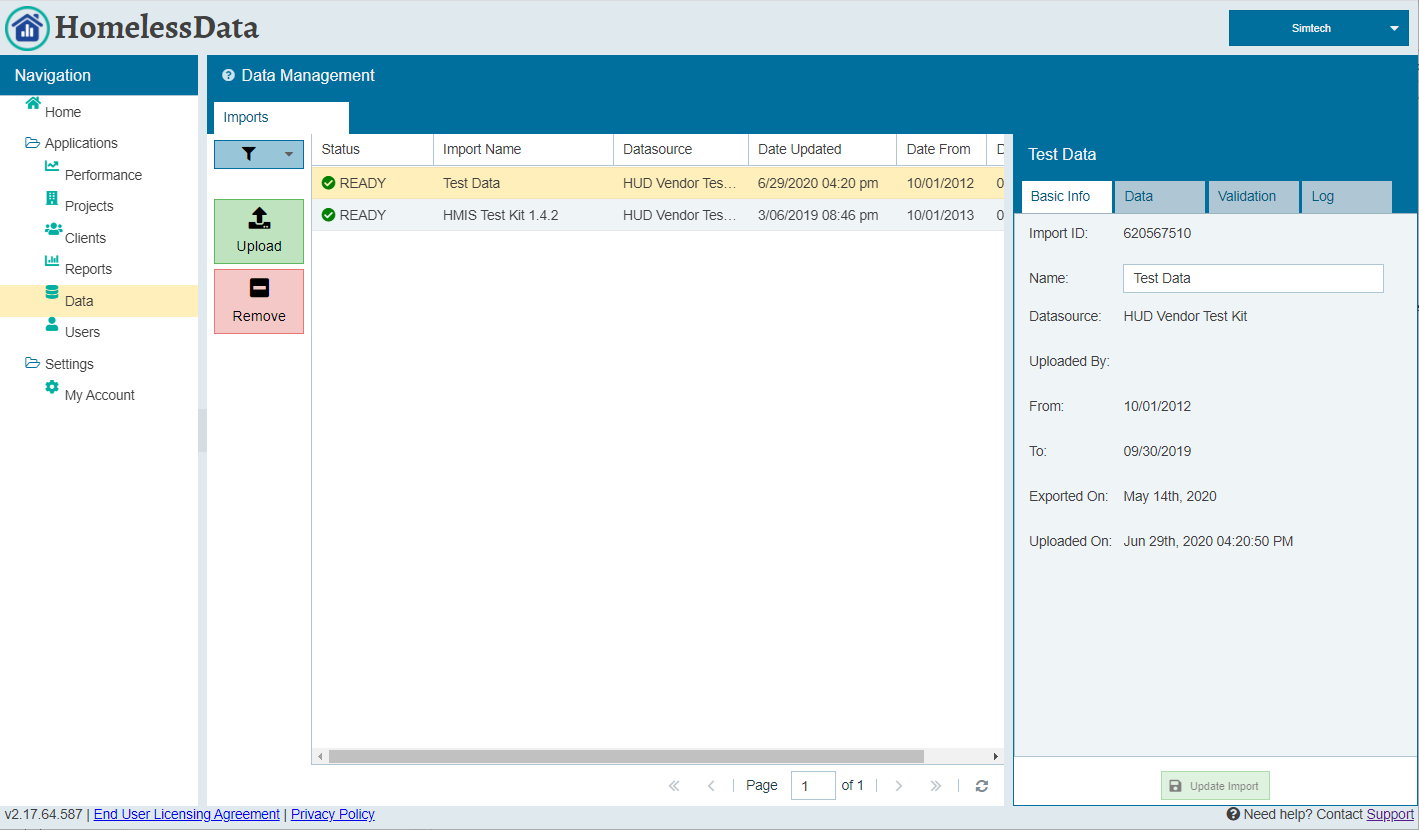
After logging into HomelessData.com, a dashboard will be displayed that shows high-level stats for your region on the Home page. The “Data” application on the left navigation menu will show what data is currently in the warehouse for your region. The image below is an example of this.
Building Up Your Knowledge-Base
Some users remove data sets from the warehouse after running reports, or only send over data for the project and the date range of the reporting period. This practice undermines the value of the warehouse as the ideal practice is to build up a comprehensive picture of homelessness over time. The HUD lookback stopdate used by the System Performance Measure (SPM) reports for example, goes all the way back to October 1, 2012.
We encourage the practice of regional HMIS administrators populating the warehouse with data from October 1, 2012 to the current day. This takes the burden off of project staff and helps ensure that the warehouse contains a comprehensive picture of both the extent of homelessness, and the work being done, in the area.
Submit the Data in Chronological Order
Once historical data is sent over, it does not have to be resent. With this in mind, we encourage any HMIS administrator that has not done so to populate the warehouse starting on 10/1/2012 to 10/1/2013, then repeating the exercise for 10/1/2013 to 10/1/2014 and so on. Make sure to go from old to new as some vendors may mistakenly ignore exit assessments that occur after the export end date. The “fresher” exports will contain this info but may get overwritten if the exports are run out of sequence.
No One Day Gaps
It is important to go 10/1 to 10/1 as exporting from 10/1 to 9/30 will leave a one day gap from 9/30 to 10/1.
Ask Your HMIS Vendor to Automate the Data Exchange
HomelessData.com is ready and able to import data in an automated “lights out” process. If your vendor is interested in establishing this automated data exchange we would be happy to work with them on this.
Interpreting the Data Availability tab
Gaps between imported data sets are displayed in red on the bar chart. Data that has imported out of chronological sequence will also be displayed in red. Green bars indicate there is data present. If there is no bar then there is no data in the warehouse for that date range. Hovering over any bar with your mouse will show the exact date range that is covered.
