Project Performance
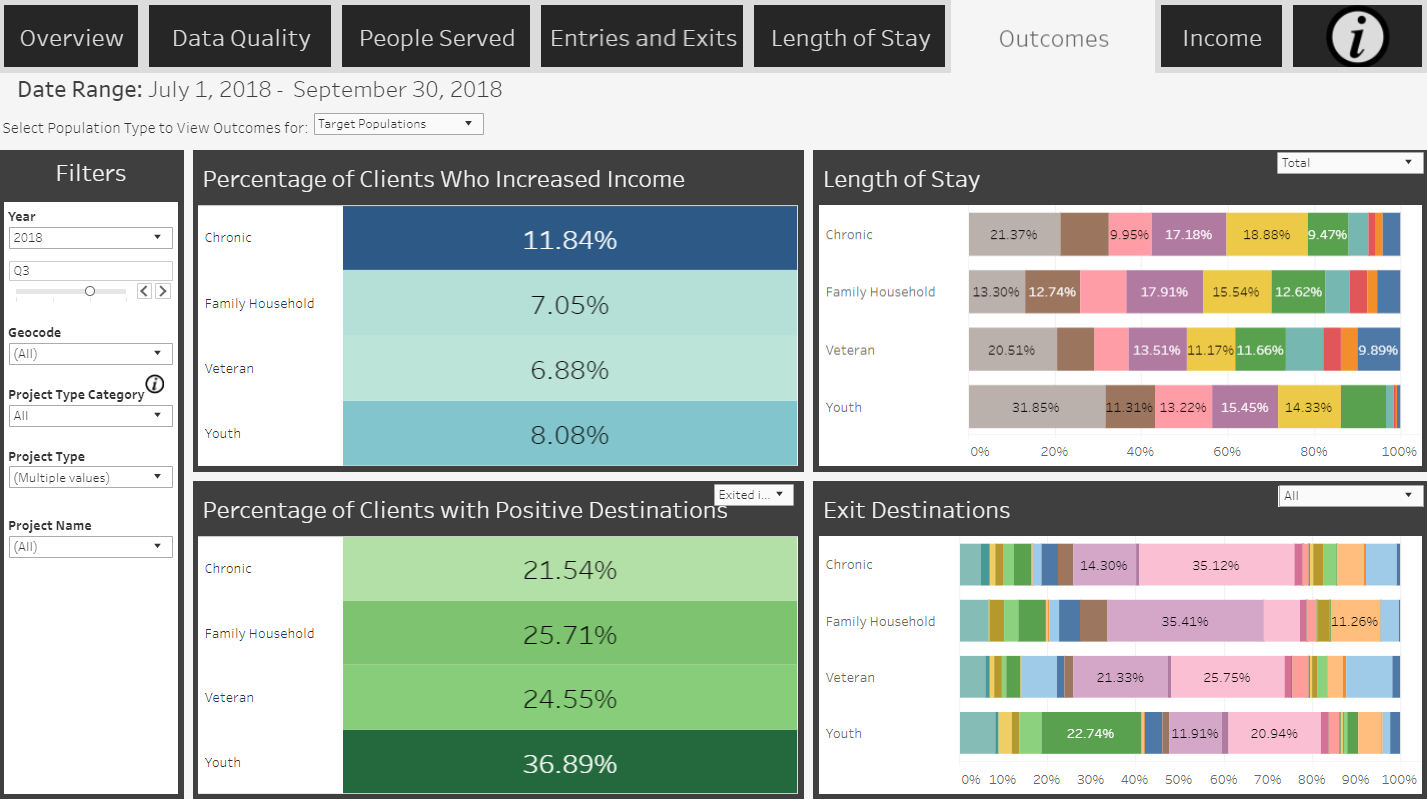
The Project Performance Dashboards dive deeper into the data and help to highlight which particular providers are contributing positively or negatively on the system performance. The dashboards provide an overview of the quality of the data, details on the demographics of clients served, as well as key metrics that can be used to measure how well each project is doing to support the clients they serve.
The dashboards are produced using an approach that protects the privacy of the clients being served by only displaying aggregate counts, not client-specific information, for a wide-variety of outcome measures. The names of the projects can also be withheld from the dashboard and replaced with unique codes. This is helpful when introducing data-driven performance evaluation into a community as it reduces any fears of public-shaming. This in turn helps to support a positive environment in which providers support one another in pursuit of common goals.
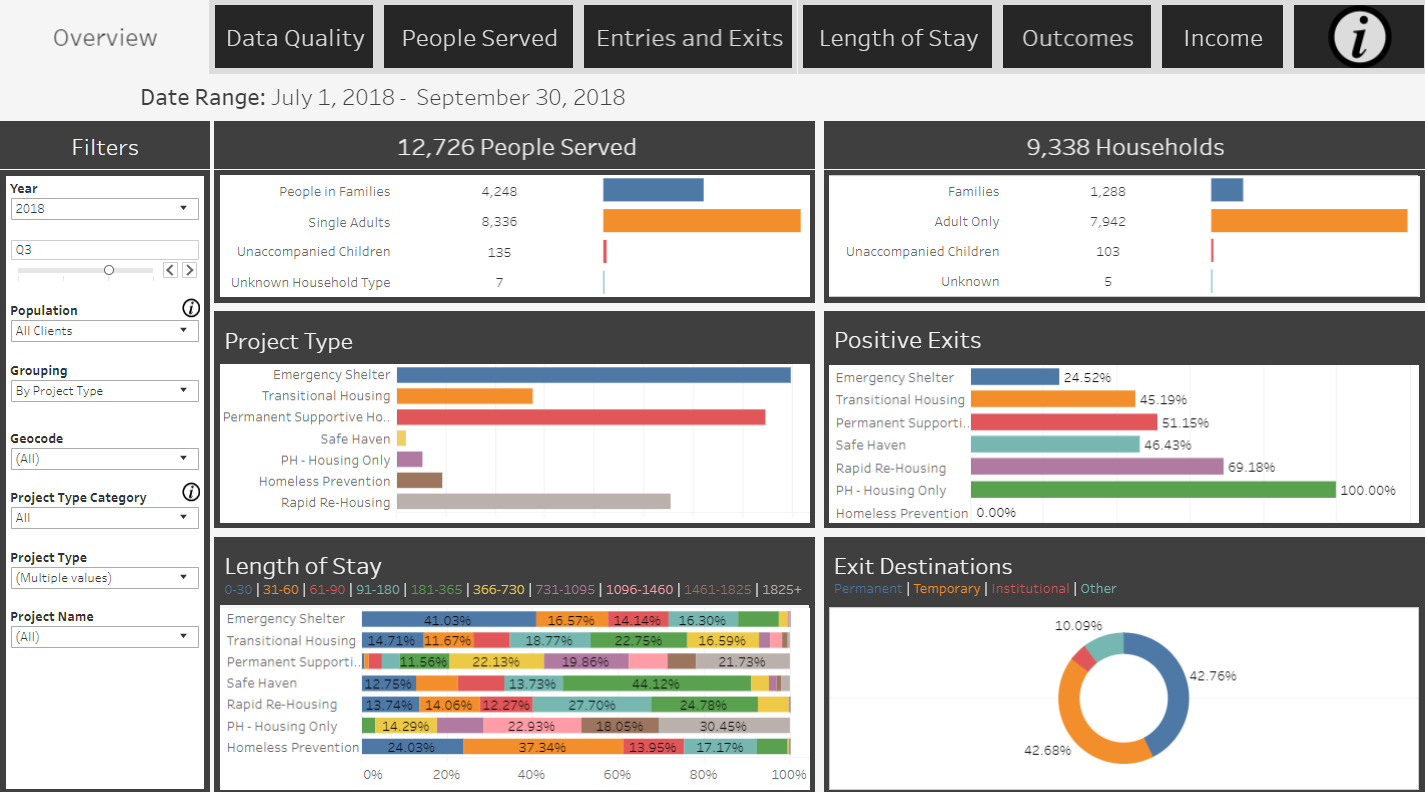
The built-in filters within the Project Performance Measurement (PPM) dashboards enable the viewer to monitor progress of initiatives targeted to sub-populations such as veterans, youth, and those who are considered chronically homeless. These tools also help to discern if there are disparities in the outcomes for people with different racial and ethnic backgrounds.
Learn more about how we build project performance dashboards here.
Click here for more details on how to use these tools to monitor and improve upon performance within my community.