
How Can We Help?
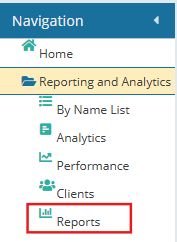
Step 1: Go to Reports
Within the Reporting and Analytics section in the Navigation panel on the left, click Reports.
Step 2: Select and run a report
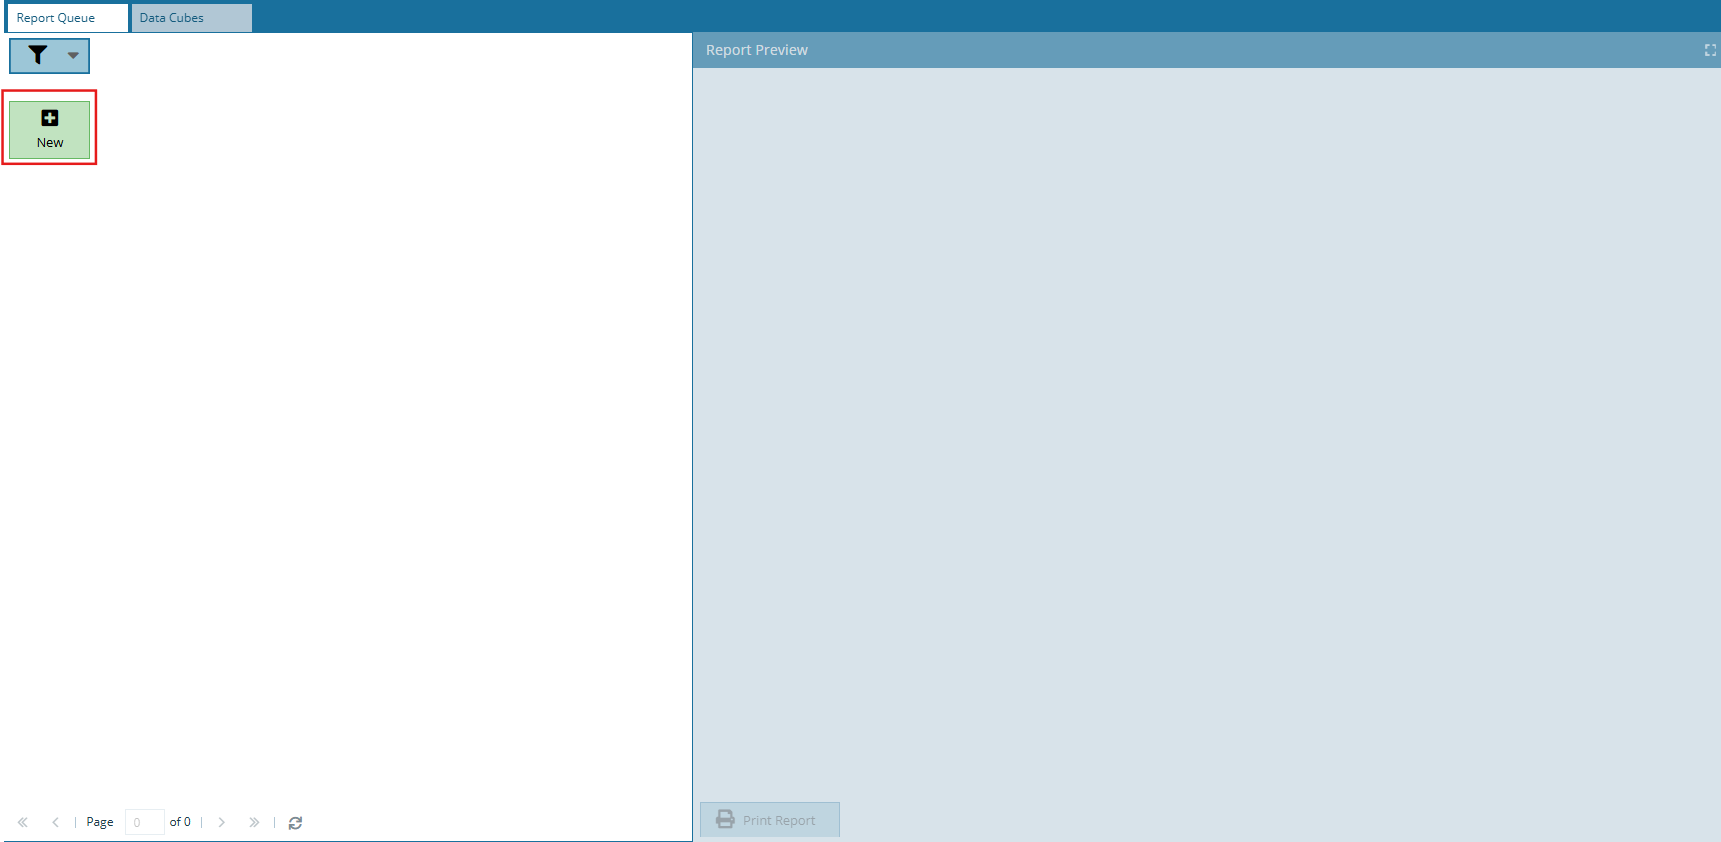
The Reports screen opens on the Report Queue tab. If you have not run a report yet, the queue will be empty, and the preview pane will be blank.
Step 3: How do I choose and set up a report?
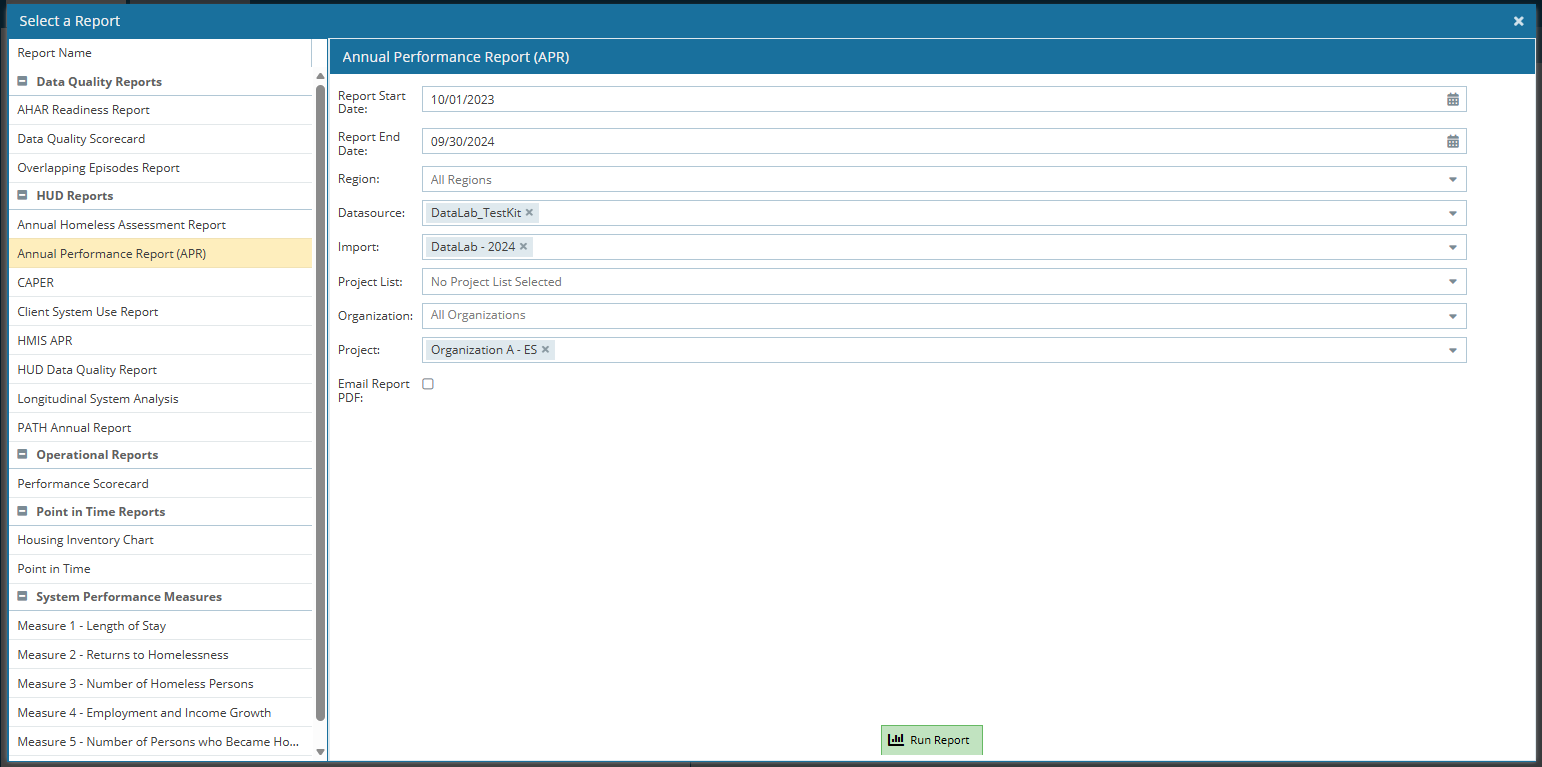
Click New. The Select a Report window opens, pick a report on the left, fill in the options on the right, then click Run Report.
Which reports can I pick?
The left list reports grouped by category. Click a report name to load its options on the right. Please note that options in the screenshot may differ from what you can see due to permissions set up by your administrator.
| Category | Reports |
|---|---|
| Data Quality Reports | Reports used for Data Quality monitoring |
| HUD Reports | Reports used for HUD reporting |
| Operational Reports | Reports used to run over processes within HomelessData |
| Point in Time Reports | Reports used for Point in Time reporting |
| System Performance Measures | Reports for each System Performance Measure |
What do the fields mean?
The screenshot shows the Annual Performance Report (APR). Other reports may show different fields.
| Field | What to enter | Example in screenshot |
|---|---|---|
| Report Start Date | First day of the reporting period | 10/01/2023 |
| Report End Date | Last day of the reporting period | 09/30/2024 |
| Region | Limit to a region, or leave on all | All Regions |
| Datasource | The data source to report on | DataLab_TestKit |
| Import | Limit to a specific import, or leave on all | DataLab – 2024 |
| Project List | Optional saved list of projects | No Project List Selected |
| Organization | Limit to an organization, or leave on all | All Organizations |
| Project | Limit to a project, or leave on all | Organization A – ES |
| Email Report PDF | Check to have the PDF emailed to you | Unchecked |
Click Run Report at the bottom of the window. The window closes and the report appears in the Report Queue.
Step 4: View your report
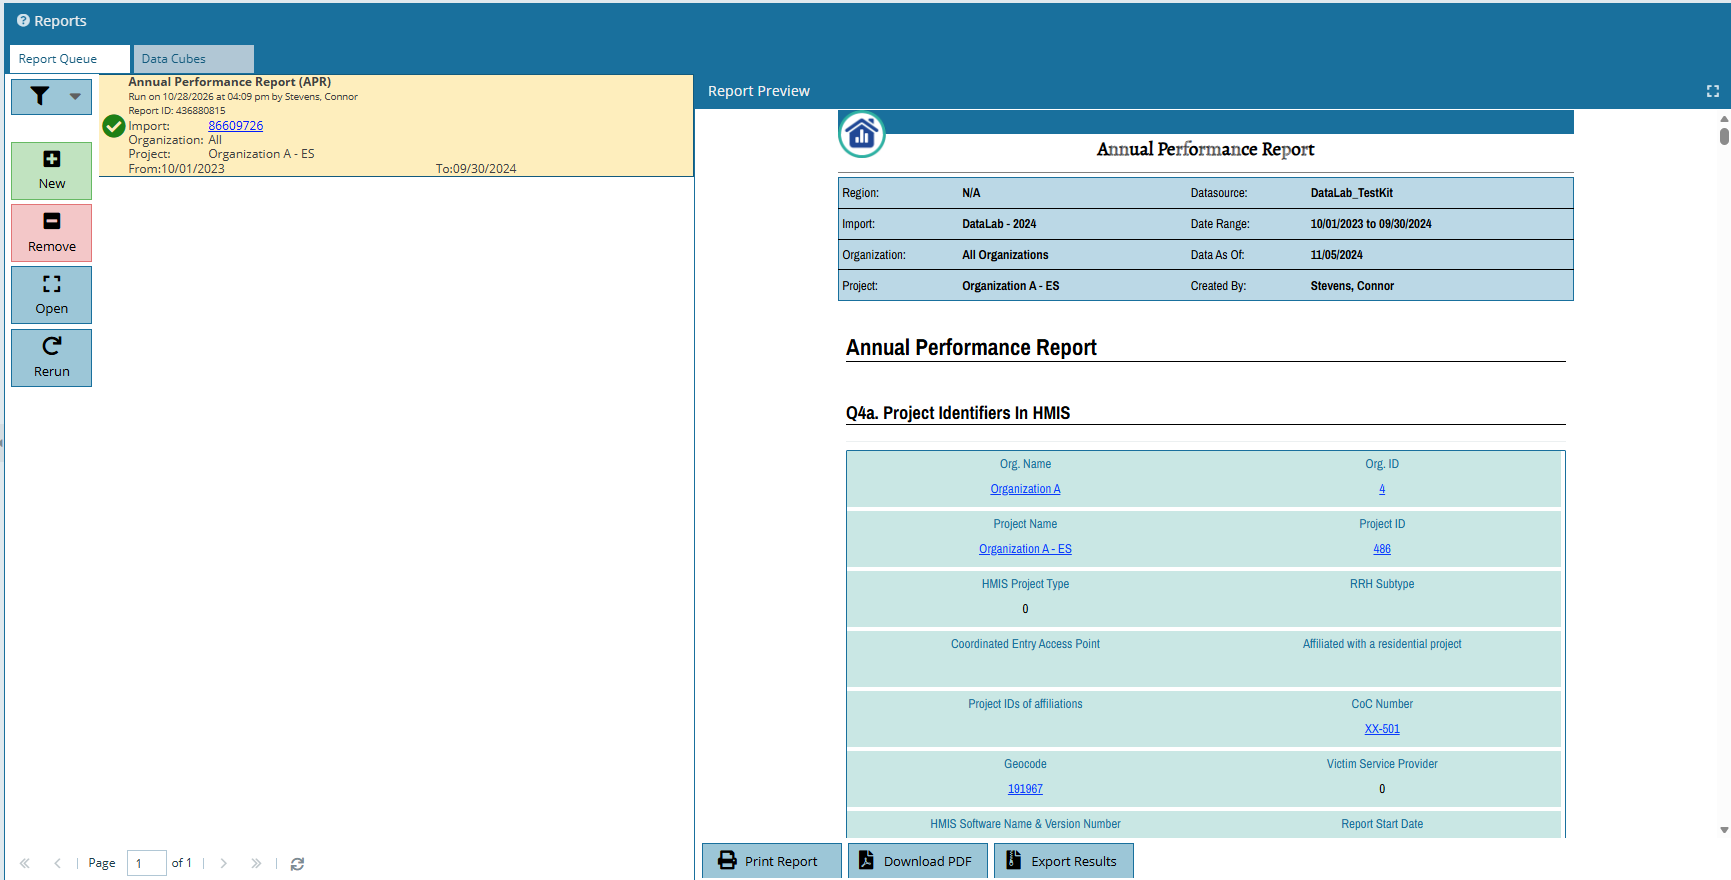
The report appears at the top of the Report Queue with a green check mark. Click it to show the report in the Report Preview pane.
What is in the queue entry?
Each entry shows the report name, when it ran and who ran it, the Report ID, and the options you chose (import, organization, project, and date range).
What are the buttons on the left?
| Button | What it does |
|---|---|
| New | Opens Select a Report to start another report. |
| Remove | Removes the selected report from the queue. |
| Open | Opens the selected report full screen. |
| Rerun | Runs the same report again with the same options. |
What are the buttons under the preview?
| Button | What it does |
|---|---|
| Print Report | Prints the report. |
| Download PDF | Saves the report as a PDF. |
| Export Results | Exports a Zip file containing a CSV for each report question. |
Quick answers
The Print Report button is greyed out. Why? No report is selected or showing in the preview pane yet. Run a report or click one in the queue.
How do I run the same report for a different period? Click New, choose the report again, and change the Report Start and End Dates.
How do I get the report out of the system? Use Download PDF for a PDF or Print Report for paper.
What does “Data As Of” mean? It is the date of the data the report was built from, shown in the summary table at the top of the report.
How do I clear old reports? Select the report in the queue and click Remove.
